
Toolkit Home | Press Outreach | Social Media | Data | Local Events | Proclamations | Graphics | Share Your Success

Statistics are up-to-date as of January 27, 2025.
Tell The Story With Data
Data is key to supporting your advocacy efforts on National Energy Assistance Day. Data helps quantify the magnitude of issues surrounding LIHEAP and energy affordability. Use the below data, or your own state or local data, to demonstrate the need for energy assistance and the impact it has on your community.
Download individual charts from this page to incorporate into your materials for Energy Assistance Day. Or use State Data Tables researched and prepared by NEADA (download here) to find more specific information for your area.
The data are broken down into the following four sections: The Need for Energy Assistance, Utility Arrears, Winter Heating Expenditures, and The Impact of LIHEAP.
The Need for Energy Assistance
Energy Burdens
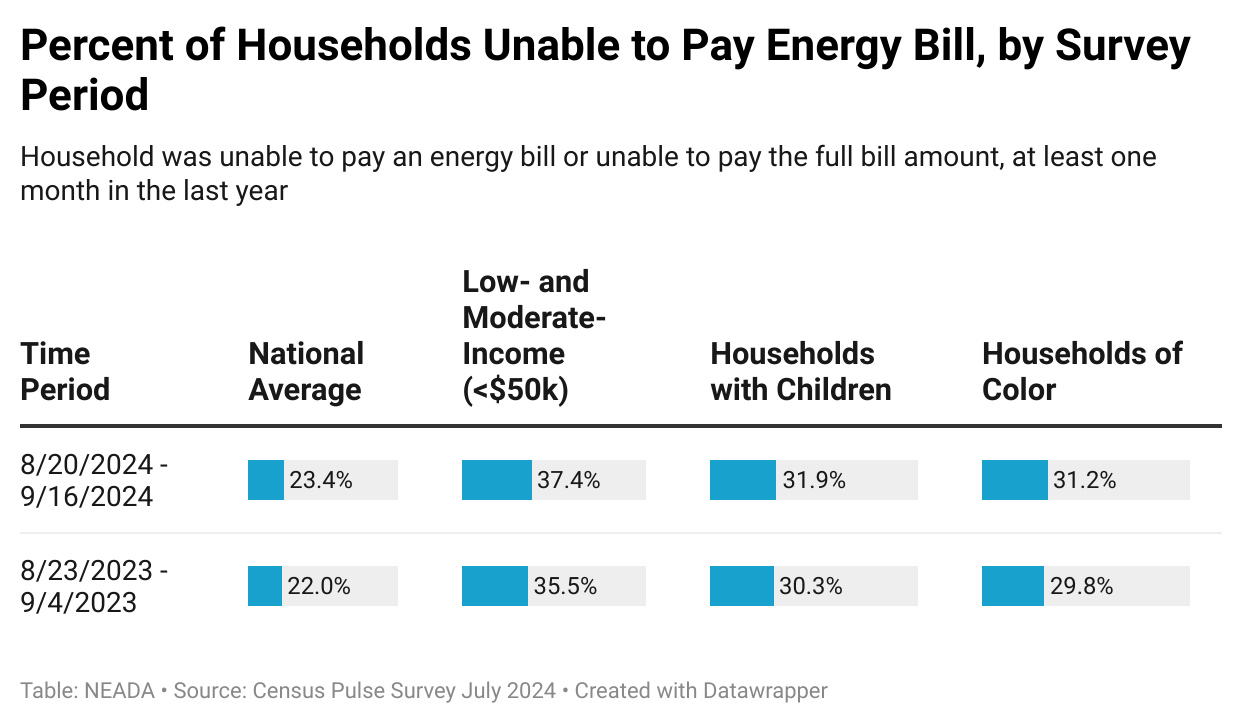
The Census Household Pulse Survey has been collecting data on the social and economic effects of the coronavirus on US households. The Pulse Survey covers numerous topics including three questions related to energy burden and hardship:
- Household was unable to pay an energy bill or pay the full amount
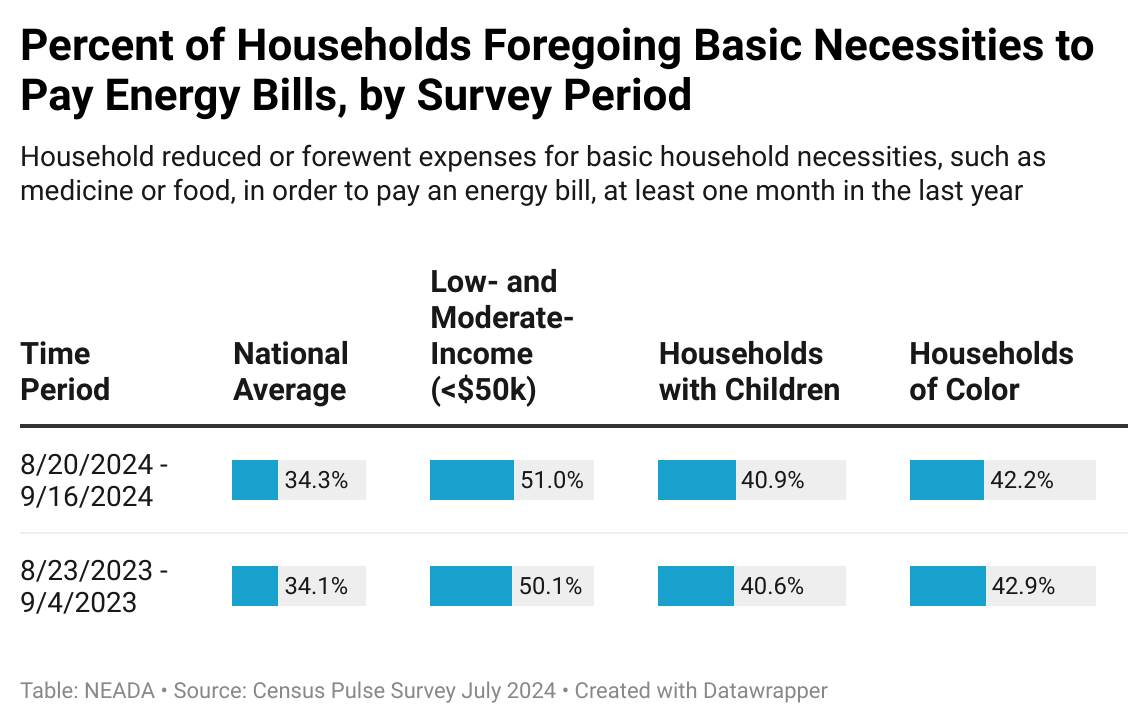
- Household reduced or forewent expenses for basic household necessities, such as medicine or food, in order to pay an energy bill
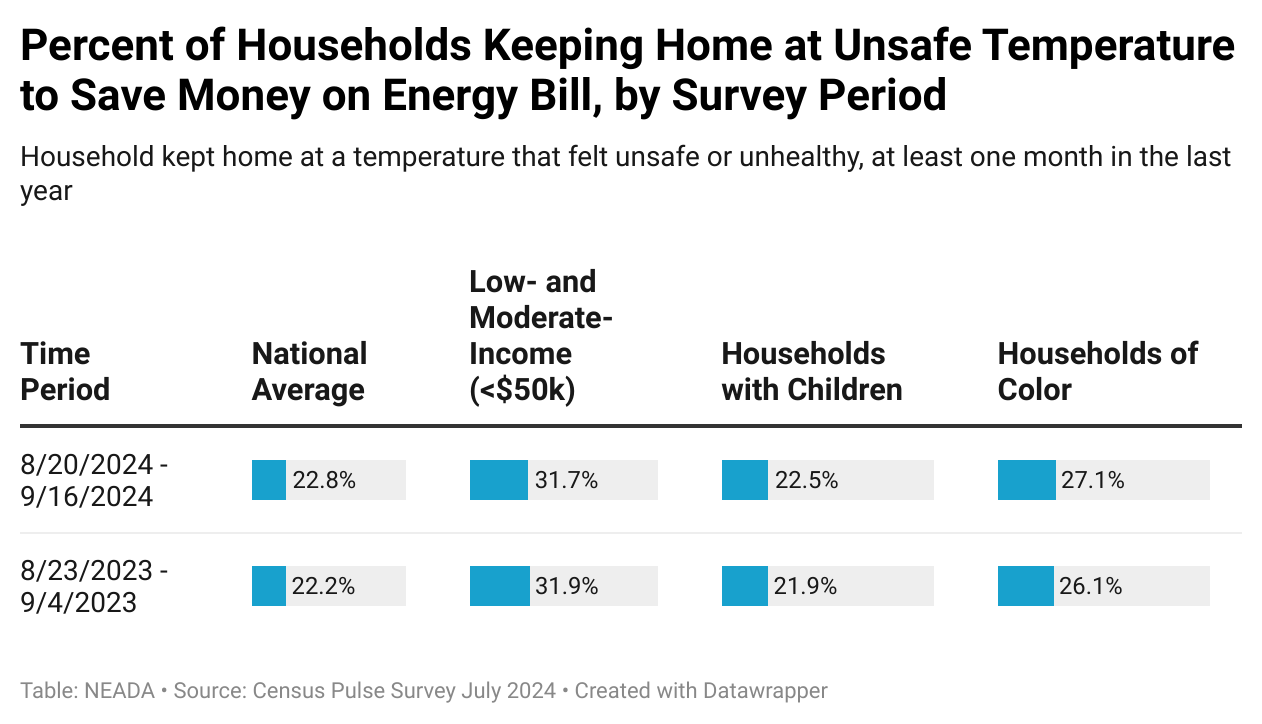
- Household kept home at a temperature that felt unsafe or unhealthy
The following charts show the percentage of households that experienced any of these hardships for one month or more in the last year.
__
__
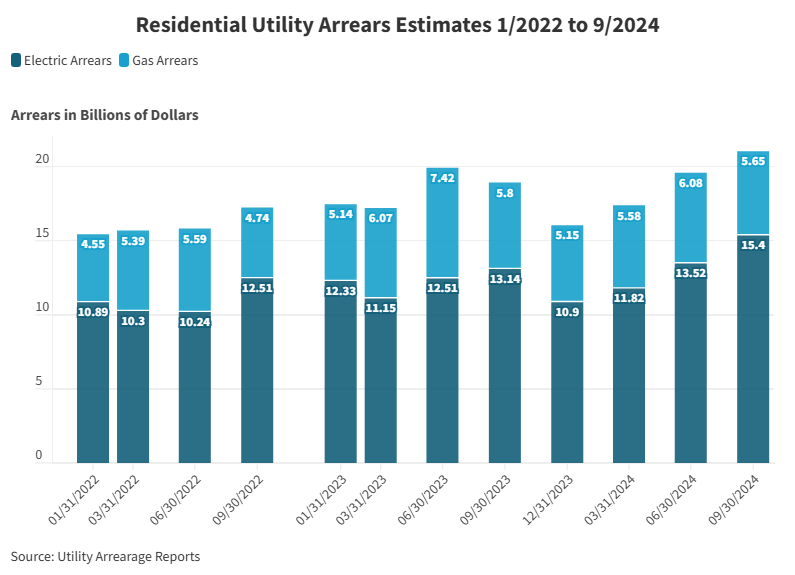
Utility Arrearages
Since the beginning of the pandemic, NEADA has been tracking utility arrearages (household debt to utilities) using data from a select number of states that report the figures publicly. As of September 2024, arrears have risen to $21.1 billion with over 21 million households (16.3% of all households) owing $15.4 billion to electric utilities and 15.1 million households owing $5.6 billion to natural gas companies. National arrears have grown by 36.3% since January 2022.

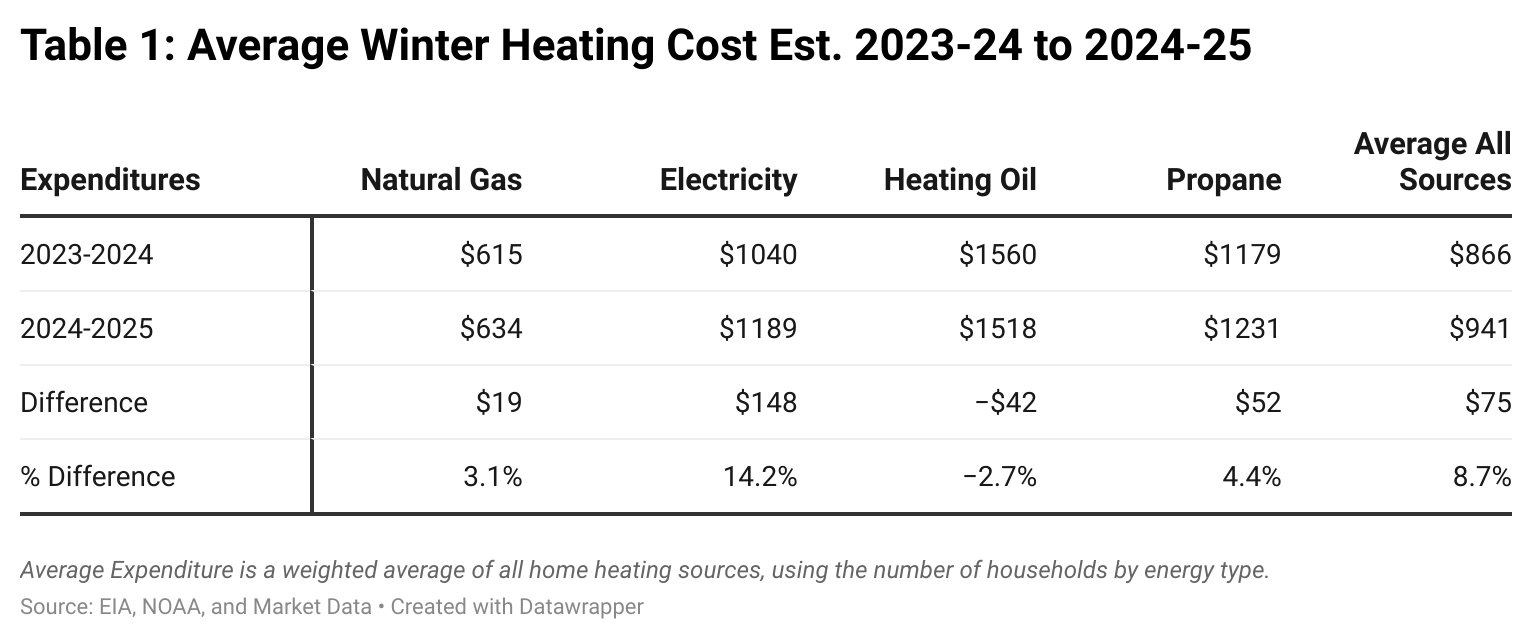
Winter Heating Expenditures
According to forecasts made by NEADA, household winter heating costs are estimated to rise in 2025, with the average household paying $941, up 8.7% from the previous winter. Rising winter heating costs are being driven by increasing electric costs — households that heat with electricity are predicted to pay $1189 in 2024-2025, a 14.2% increase from $1040 the previous winter (2023-2024).

The Impact of LIHEAP
Home heating costs are becoming increasingly unaffordable, with 23.4% of households reporting being unable to pay an energy bill in the most recent Census Pulse Survey. LIHEAP, the federal program to help with residential energy costs, only has enough funding to serve 1 in 6 eligible households.
In 2023, 7.2 million households received energy assistance through LIHEAP.